 Storm Peak Data
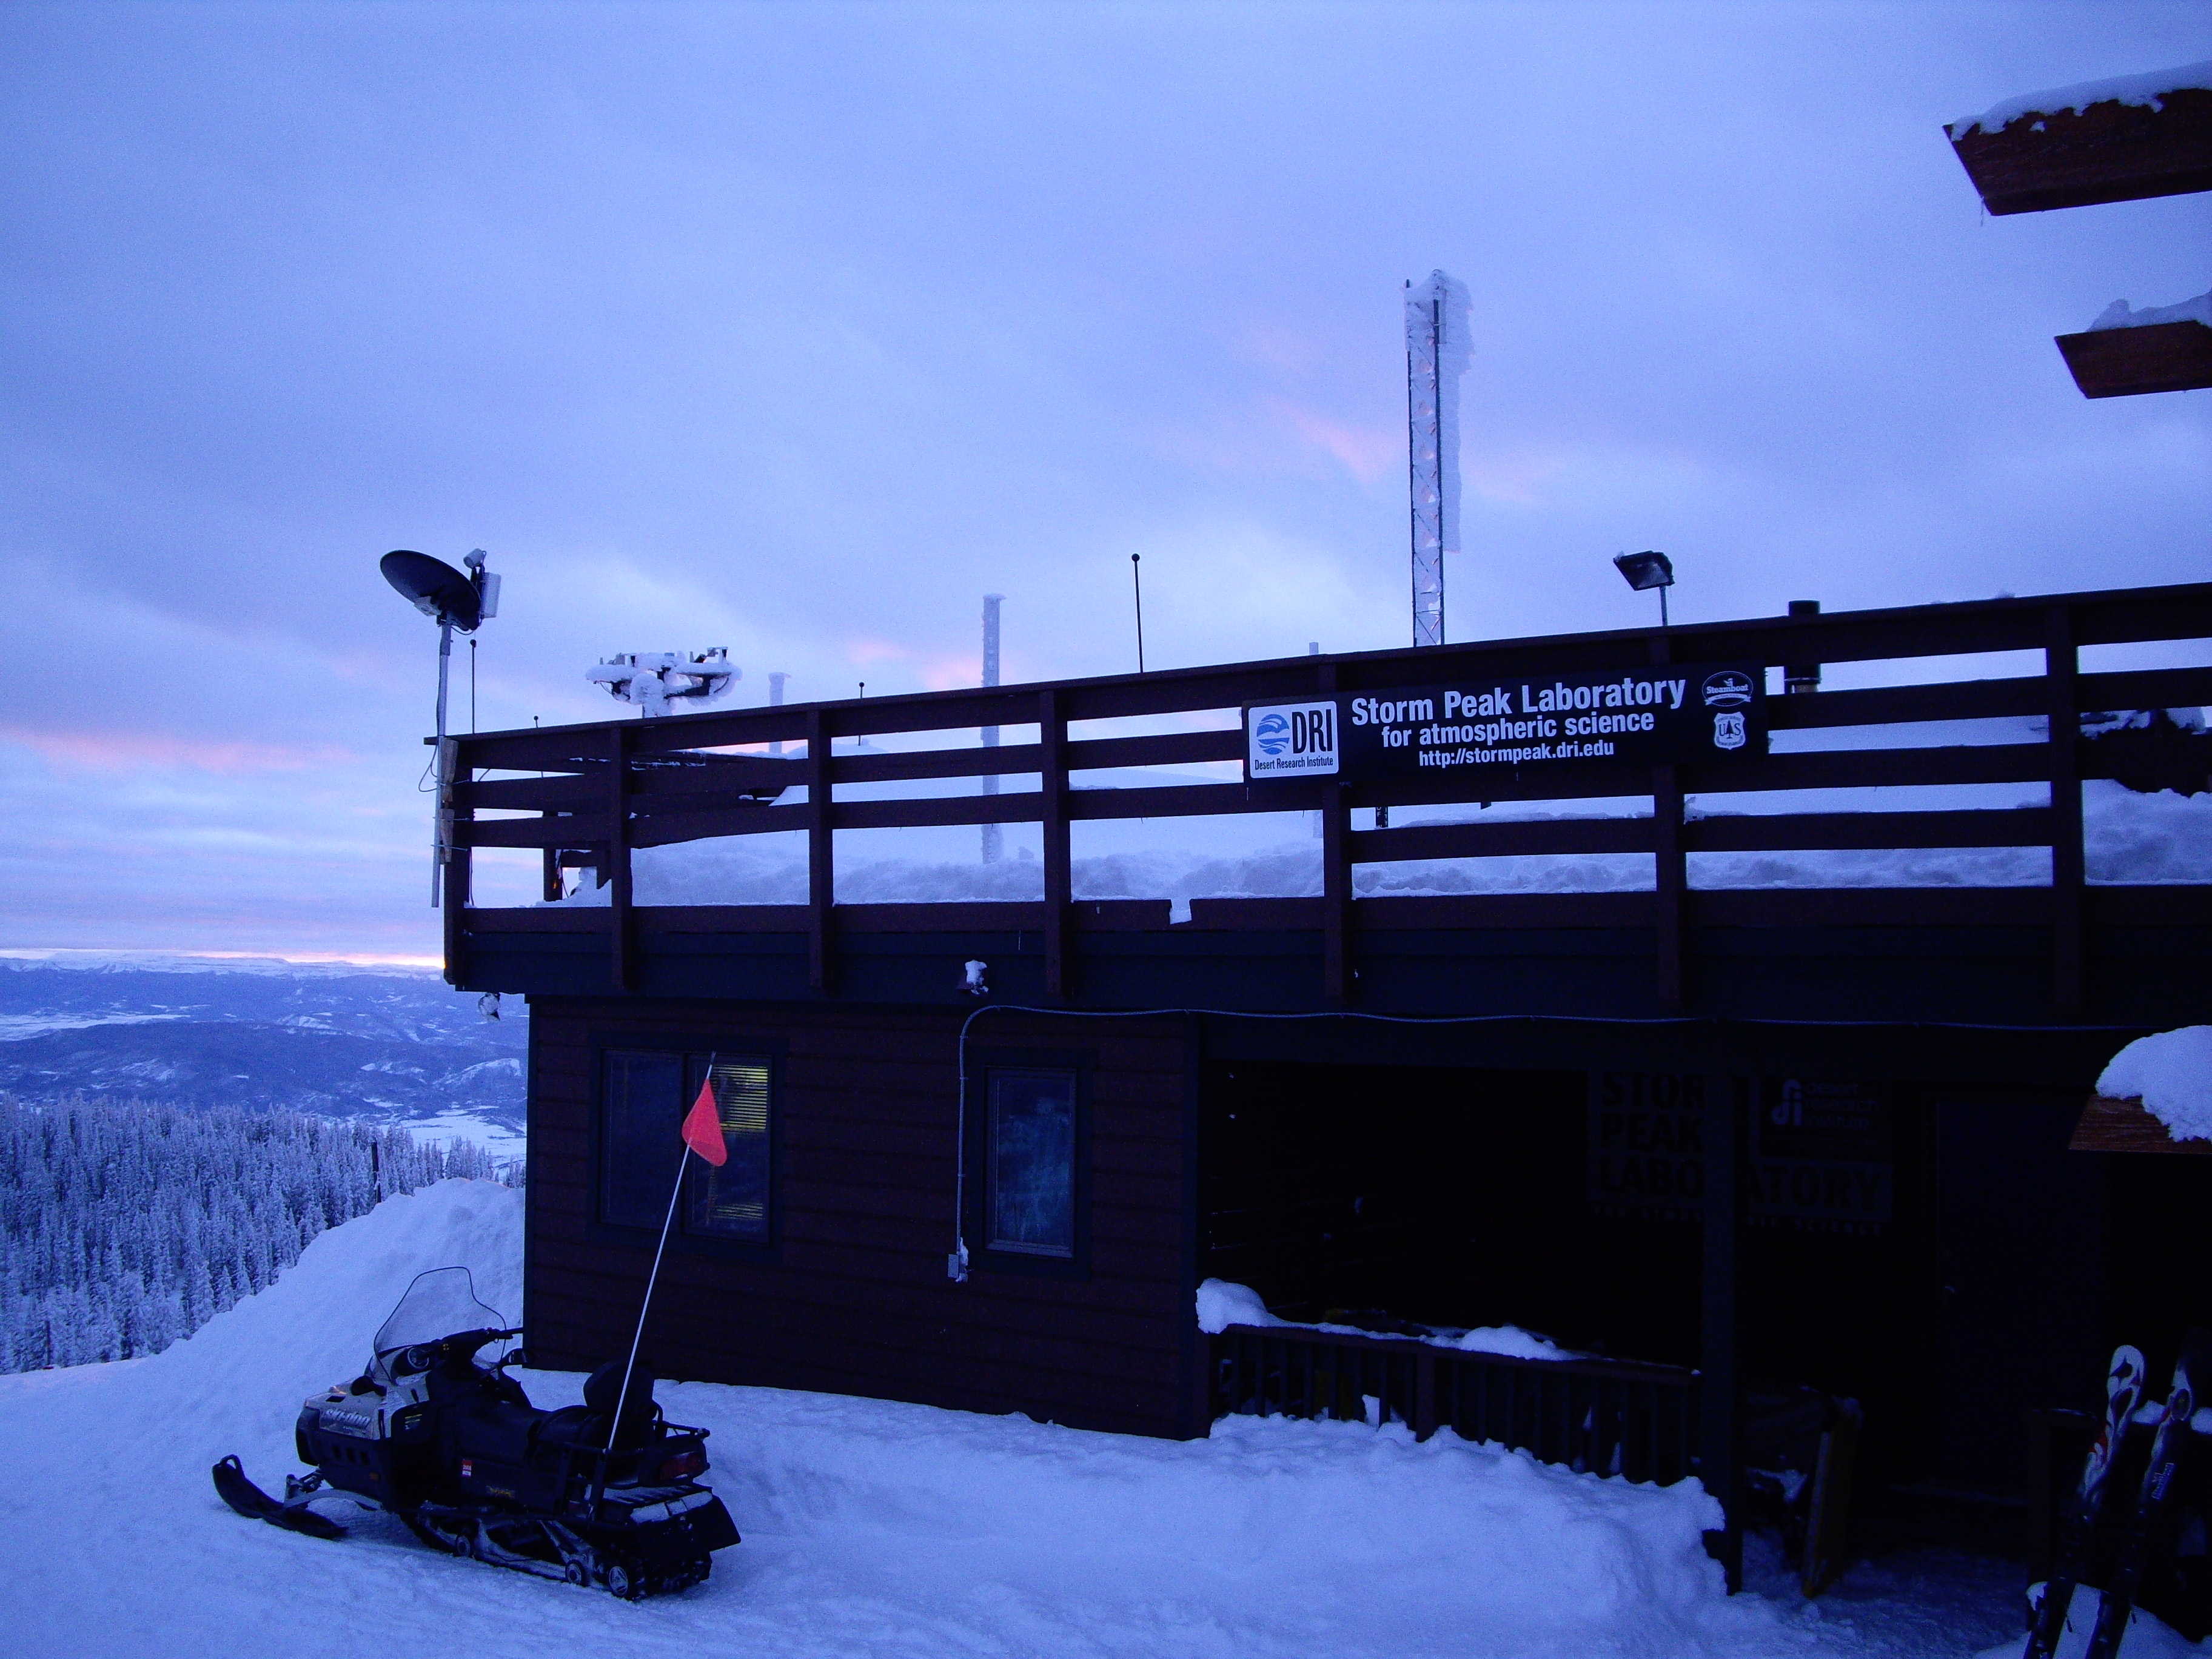 SPL photos
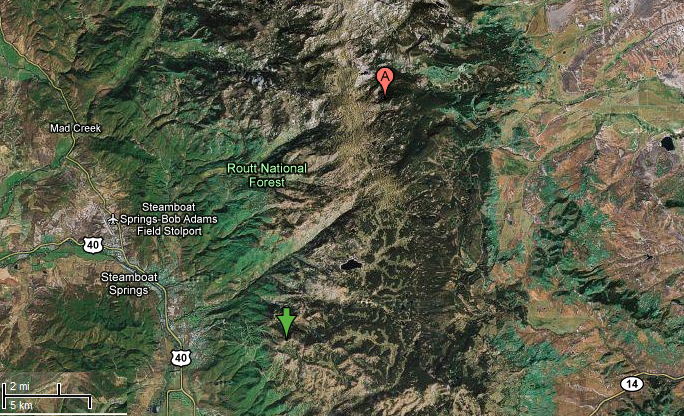 SPL maps
Welcome to the North Carolina State University Storm Peak data page. You will find a variety of data available for download, various pictures and images detailing the SPL, as well as other features of interest related to the field experiment.
This material is based upon work supported by the National Science Foundation under Grant No. 0835368. Any opinions, findings and conclusions or recommendations expressed in this material are those of the authors and do not necessarily reflect the views of the National Science Foundation (NSF).
| MRR | Year | Month | Day | Start Time (UTC) | Duration (hrs) | Temp. (°C) | Avg. Wind Direction (deg) | Avg. Wind Speed (m/s) | Snowfall (mm) | SWE (mm) | Pressure (mb) | RH | ||||||||||
|---|---|---|---|---|---|---|---|---|---|---|---|---|---|---|---|---|---|---|---|---|---|---|
| - | - | - | - | - | Max | Min | Avg | Max | Min | Avg | Max | Min | Avg | - | - | Max | Min | Avg | Max | Min | Avg | |
 |
2010 | 1 | 17 | 07 | 1 | -2.1 | -3.3 | -2.5 | 279 | 228 | 257 | 2.1 | 1.2 | 1.6 | 1 | 1 | 683.7 | 683.4 | 683.5 | 75.0 | 65.8 | 69.4 |
 |
2010 | 1 | 18 | 10 | 8 | -7.3 | -8.2 | -7.9 | 235 | 118 | 187 | 10.8 | 1.4 | 4.2 | 1 | 1 | 680.7 | 678.3 | 680.0 | 100 | 100 | 100 |
 |
2010 | 1 | 19 | 02 | 16 | -7.1 | -10.8 | -8.9 | 302 | 213 | 255 | 9.8 | 1.7 | 5.7 | 1 | 1 | 677.3 | 674.6 | 676.0 | 100 | 98.4 | 100 |
 |
2010 | 1 | 20 | 08 | 16 | -7.9 | -11.7 | -10.3 | 307 | 136 | 223 | 9.6 | 1.2 | 5.1 | 1 | 1 | 674.2 | 671.5 | 673.2 | 100 | 97.8 | 98.9 |
 |
2010 | 1 | 21 | 06 | 9 | -6.7 | -8.8 | -7.7 | 197 | 93 | 139 | 9.2 | 0.8 | 5.4 | 1 | 1 | 672.2 | 669.8 | 671.1 | 100 | 88.9 | 96.2 |
 |
2010 | 1 | 21 | 20 | 11 | -4.7 | -7.3 | -6.1 | 249 | 108 | 166 | 19.7 | 2.2 | 9.6 | 1 | 1 | 667.5 | 665.8 | 666.6 | 100 | 58.4 | 83.3 |
 |
2010 | 1 | 22 | 14 | 28 | -10.6 | -14.4 | -12.3 | 321 | 221 | 278 | 12.9 | 1.7 | 7.5 | 1 | 1 | 674.6 | 668.5 | 671.1 | 98.7 | 95.2 | 97.2 |
 |
2010 | 1 | 25 | 12 | 6 | -12.6 | -13.1 | -12.9 | 312 | 162 | 268 | 7.2 | 0.8 | 4.3 | 1 | 1 | 684.7 | 683.7 | 684.3 | 96.7 | 96.1 | 96.4 |
 |
2010 | 1 | 26 | 11 | 15 | -8.8 | -9.3 | -9.1 | 328 | 230 | 275 | 8.5 | 1.2 | 4.6 | 1 | 1 | 685.4 | 682.7 | 683.5 | 100 | 99.7 | 99.9 |
 |
2010 | 1 | 27 | 15 | 23 | 0.0 | -8.4 | -6.2 | 359 | 000 | 116 | 6.3 | 0.8 | 3.0 | 1 | 1 | 686.8 | 684.4 | 685.5 | 100 | 100 | 100 |
 |
2010 | 1 | 31 | 13 | 1 | -10.8 | -11.0 | -10.9 | 286 | 258 | 270 | 8.2 | 5.7 | 7.3 | 1 | 1 | 680.3 | 680.0 | 680.2 | 98.7 | 98.2 | 98.5 |
 |
2010 | 1 | 31 | 19 | 24 | -11.7 | -13.3 | -12.4 | 312 | 210 | 276 | 9.7 | 3.6 | 6.8 | 1 | 1 | 684.1 | 680.0 | 681.8 | 98.1 | 95.6 | 97.0 |
 |
2010 | 2 | 4 | 01 | 20 | -11.1 | -13.1 | -12.0 | 312 | 259 | 288 | 8.8 | 4.2 | 6.9 | 1 | 1 | 681.7 | 678.0 | 679.4 | 98.1 | 96.0 | 97.3 |
 |
2010 | 2 | 5 | 15 | 17 | -7.2 | -9.0 | -8.6 | 290 | 194 | 245 | 7.8 | 2.5 | 4.9 | 1 | 1 | 684.1 | 682.0 | 683.3 | 100 | 100 | 100 |
 |
2010 | 2 | 11 | 13 | 12 | -12.0 | -12.6 | -12.2 | 341 | 230 | 281 | 12.0 | 4.6 | 8.4 | 1 | 1 | 683.4 | 682.4 | 683.0 | 97.5 | 96.9 | 97.3 |
 |
2010 | 2 | 12 | 08 | 48 | -7.5 | -14.9 | -10.8 | 360 | 3 | 292 | 13.0 | 3.1 | 7.3 | 1 | 1 | 686.8 | 682.4 | 684.2 | 100 | 94.9 | 98.6 |
 |
2010 | 2 | 17 | 08 | 39 | -5.3 | -14.1 | -9.5 | 323 | 175 | 261 | 6.9 | 0.8 | 3.1 | 1 | 1 | 685.4 | 679.0 | 682.2 | 100 | 95.1 | 99.3 |
 |
2010 | 2 | 19 | 09 | 38 | -5.2 | -14.4 | -10.8 | 337 | 99 | 228 | 7.1 | 0.8 | 2.5 | 1 | 1 | 678.0 | 673.9 | 676.1 | 100 | 94.7 | 98.0 |
 |
2010 | 2 | 21 | 04 | 15 | -4.9 | -19.7 | -14.3 | 360 | 2 | 297 | 5.3 | 0.8 | 1.7 | 1 | 1 | 678.3 | 675.3 | 676.3 | 100 | 86 | 93.6 |
 |
2010 | 2 | 24 | 13 | 40 | -7.7 | -12.9 | -10.7 | 337 | 221 | 295 | 8.1 | 0.9 | 3.6 | 1 | 1 | 688.8 | 680.3 | 683.8 | 100 | 96.5 | 98.6 |
 |
2010 | 2 | 27 | 20 | 7 | -4.6 | -7.1 | -6.3 | 359 | 0 | 162 | 4.7 | 0.8 | 1.8 | 1 | 1 | 679.7 | 678.3 | 678.8 | 97.2 | 70.3 | 85.7 |
 |
2010 | 2 | 28 | 09 | 15 | -5.8 | -9.7 | -7.9 | 360 | 0 | 152 | 2.6 | 0.8 | 1.3 | 1 | 1 | 685.8 | 679.0 | 682.7 | 100 | 99.2 | 100 |
| - | - | - | - | - | Max | Min | Avg | Max | Min | Avg | Max | Min | Avg | - | - | Max | Min | Avg | Max | Min | Avg | |
| MRR | Year | Month | Day | Start Time (LST) | Duration (hrs) | Temp. (°C) | Avg. Wind Direction (deg) | Avg. Wind Speed (m/s) | Snowfall (mm) | SWE (mm) | Pressure (mb) | RH | ||||||||||
|
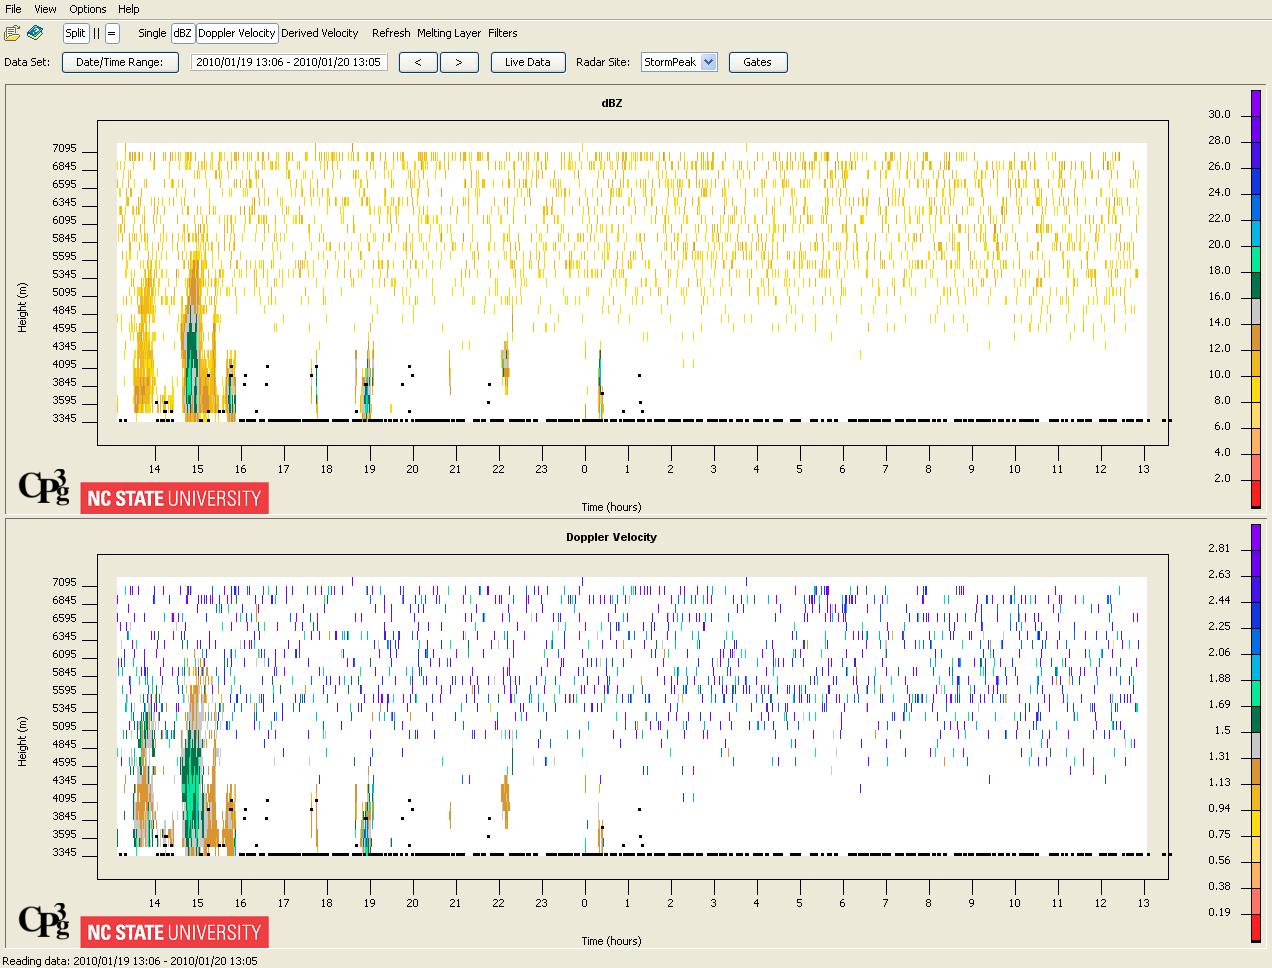
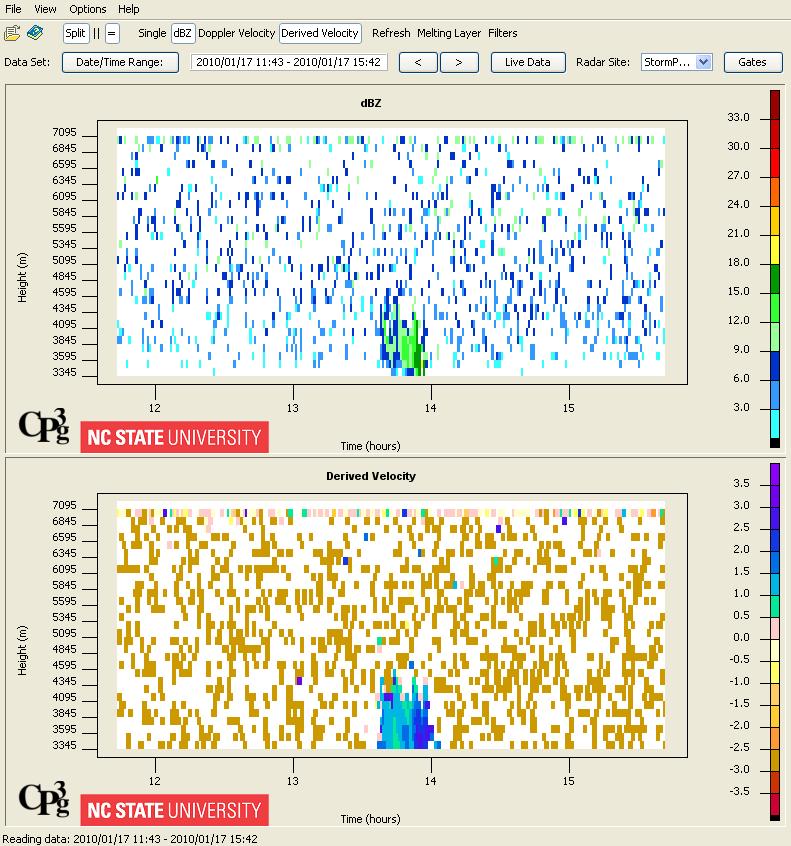
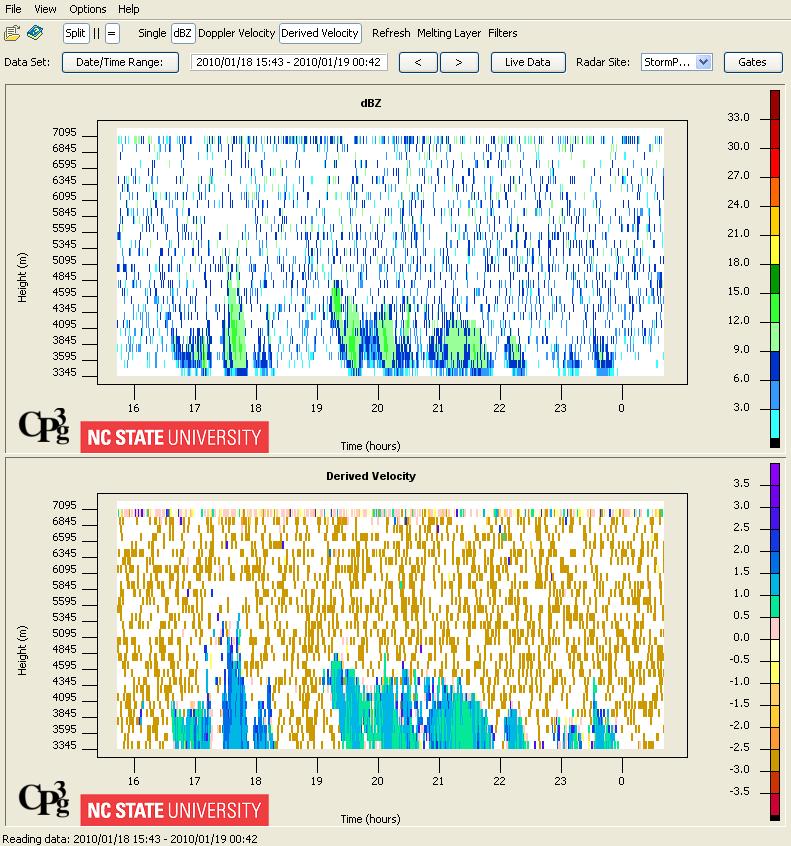
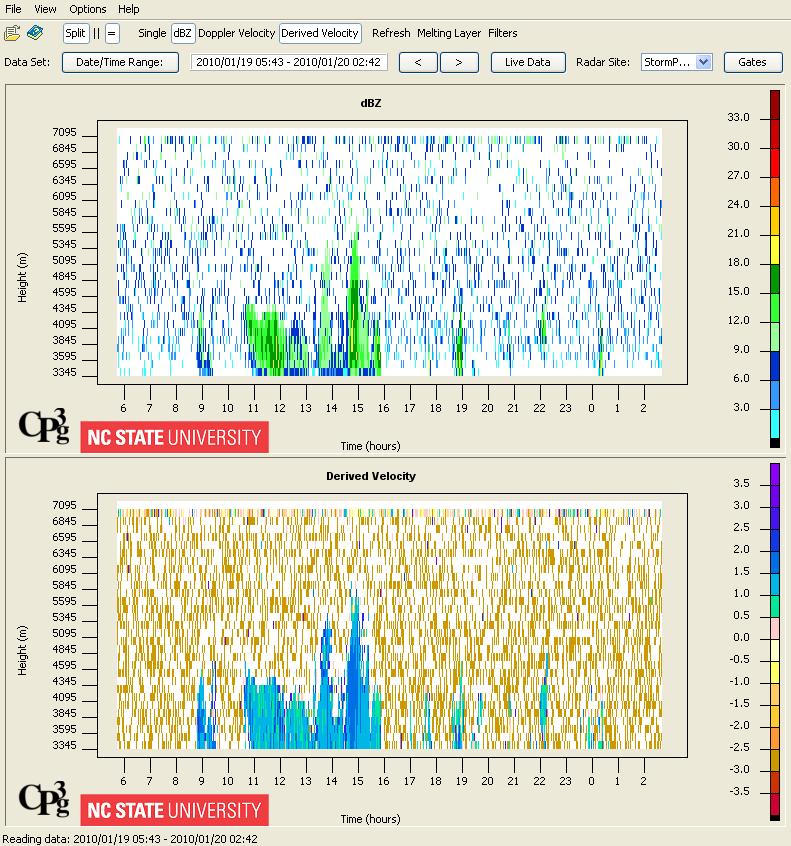
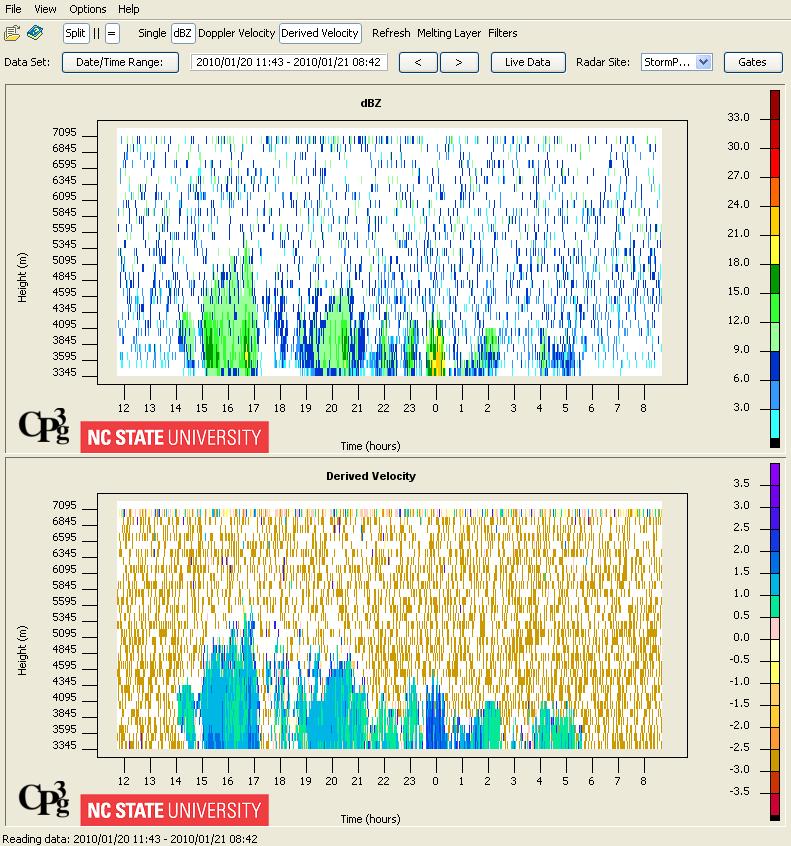
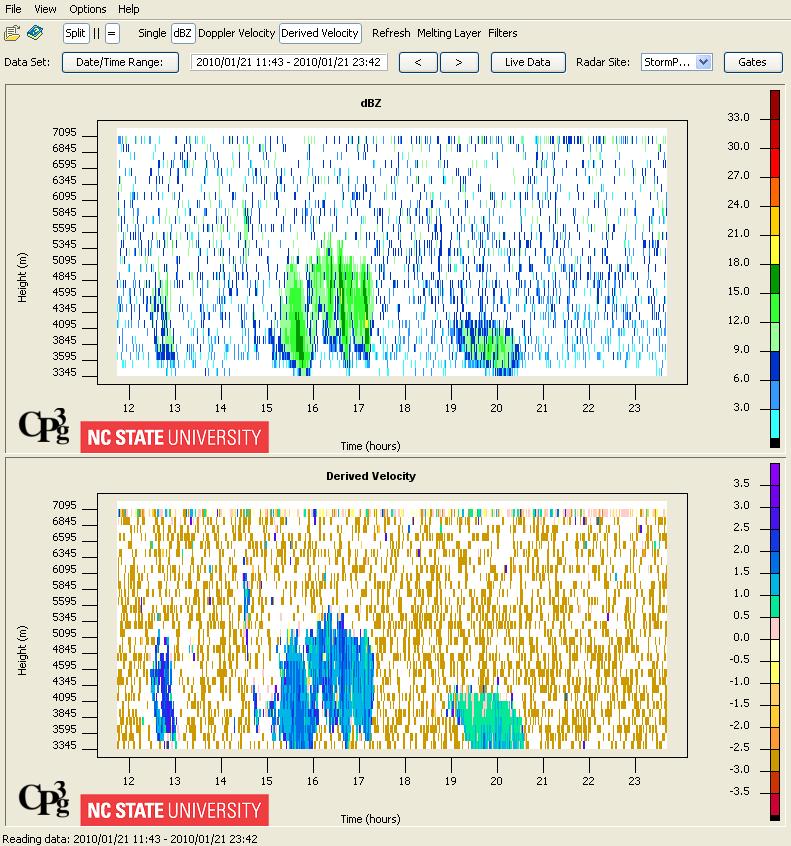
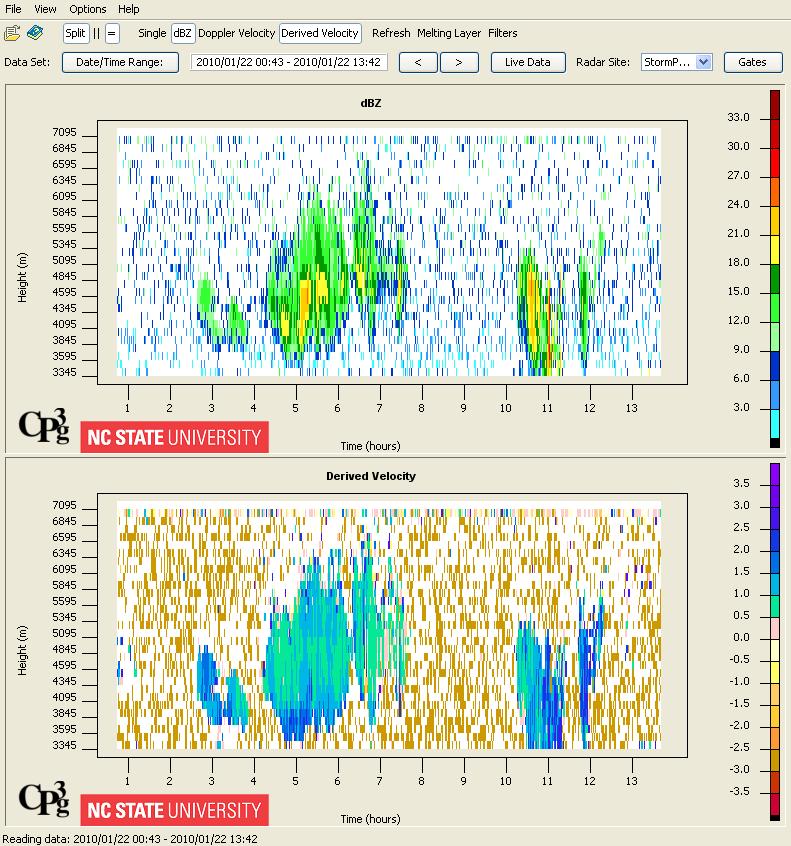
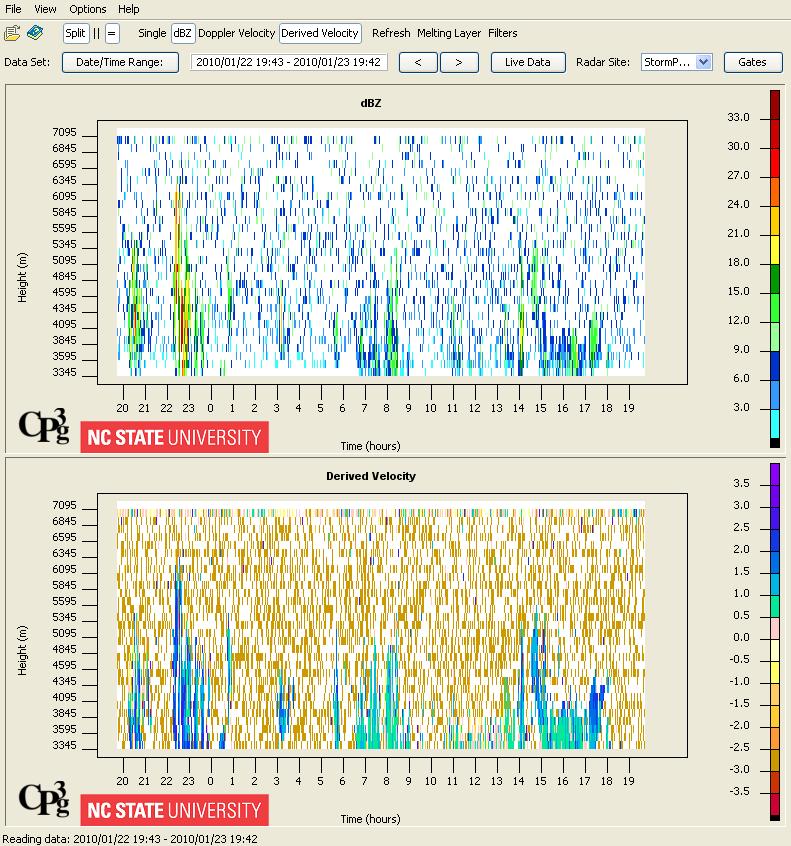
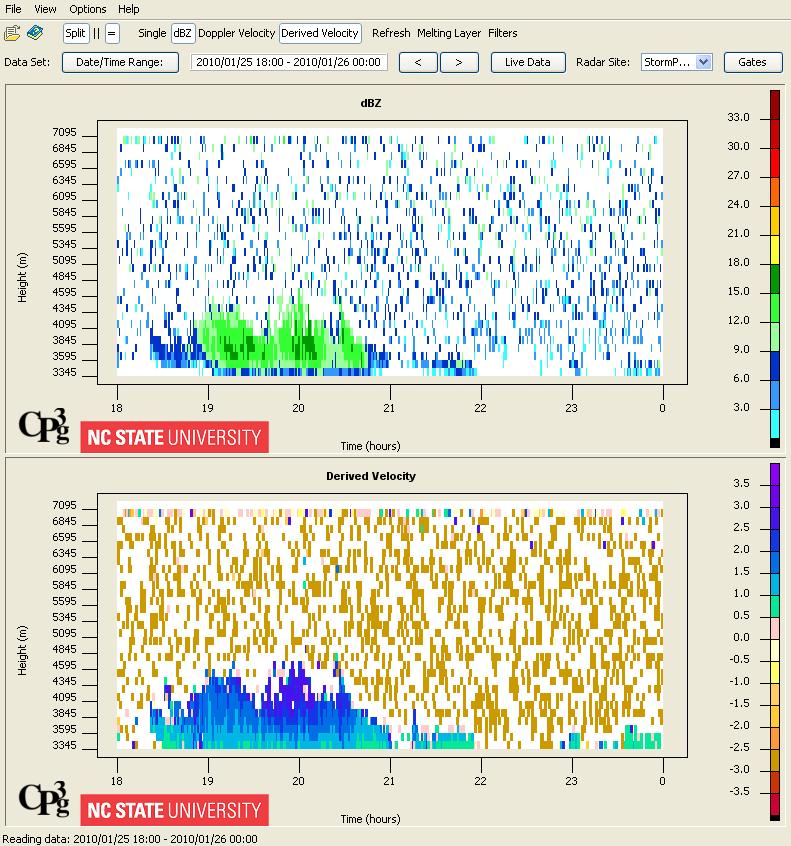
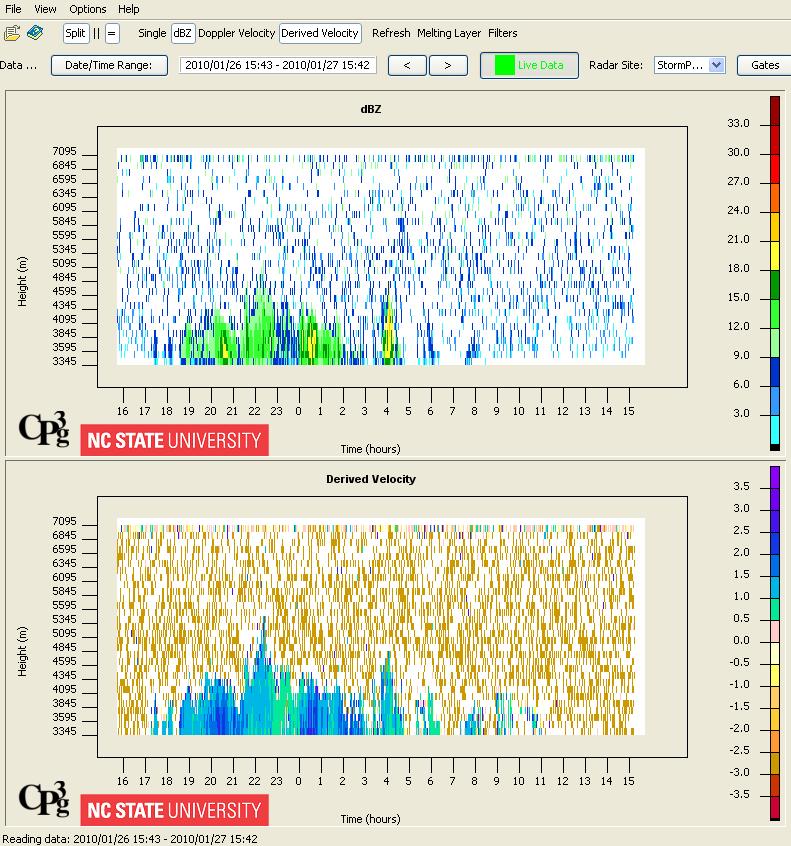
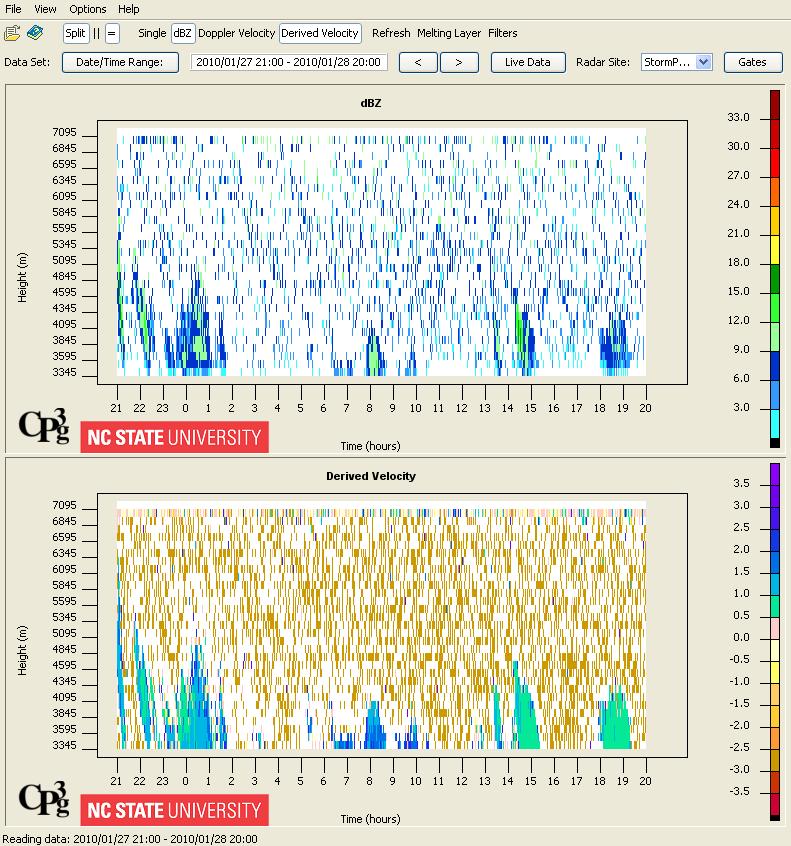
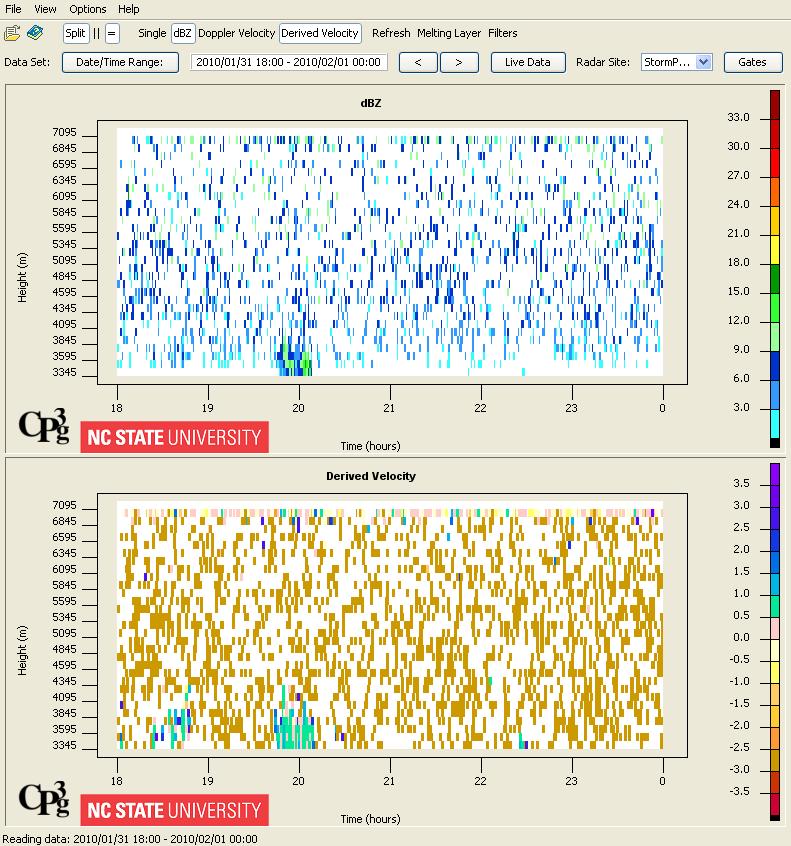
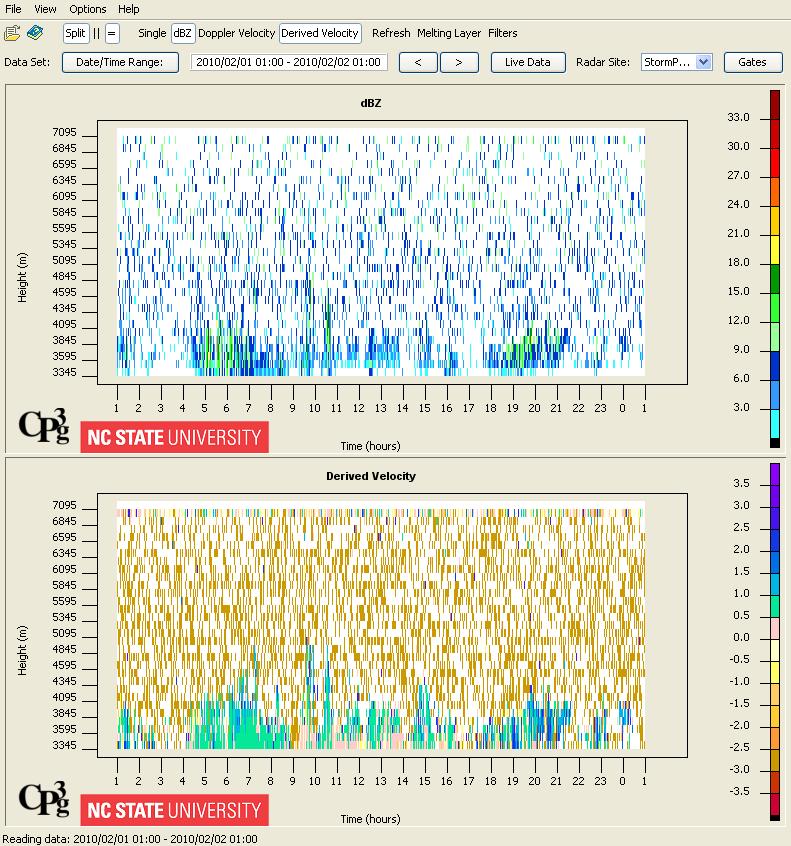
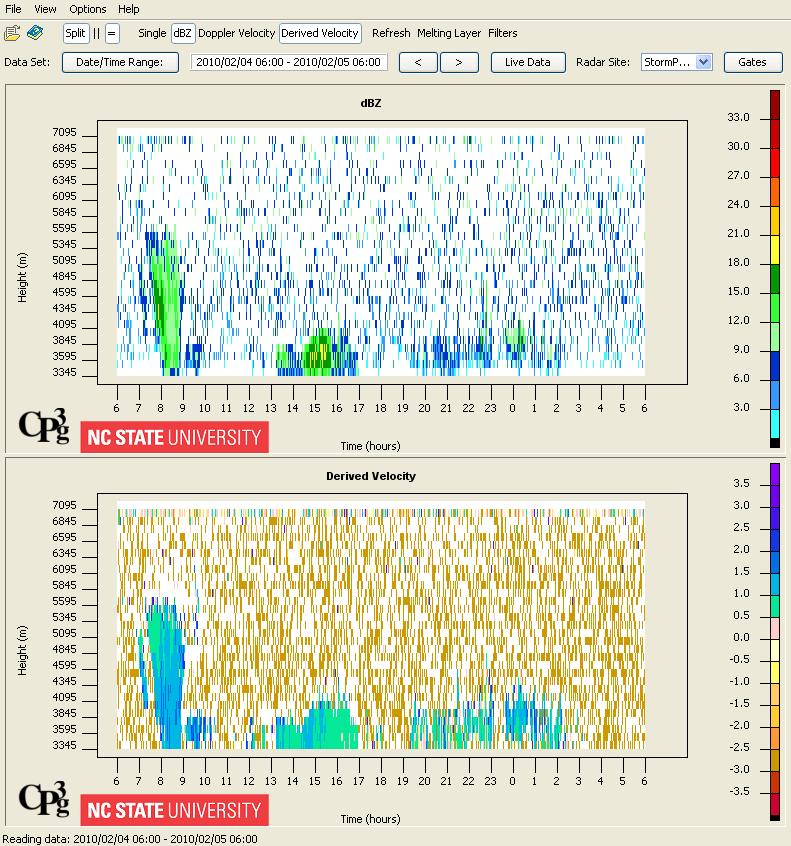
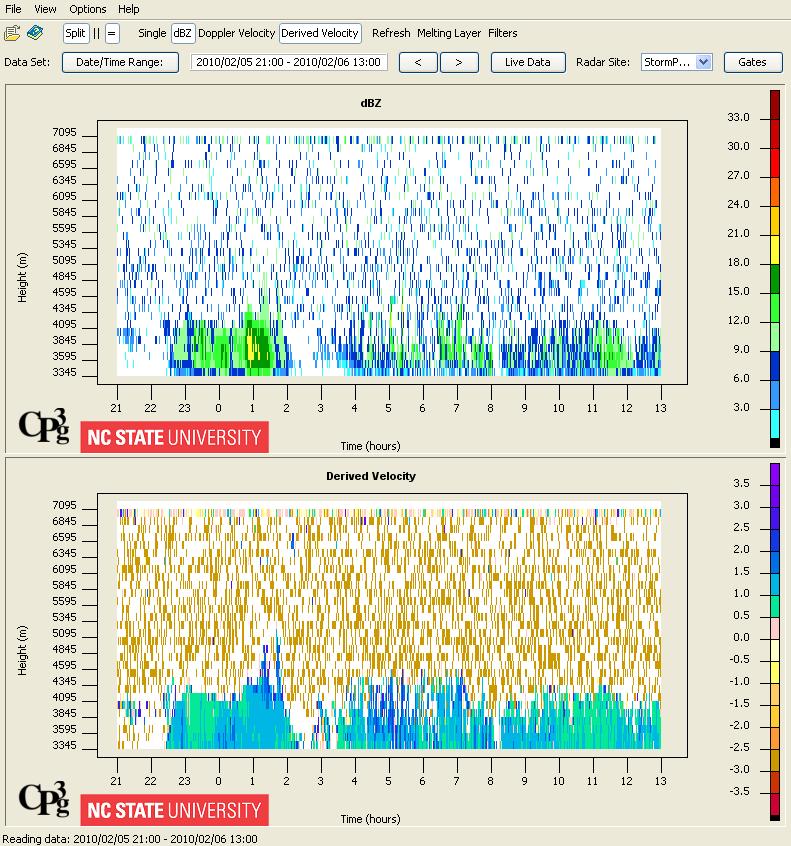
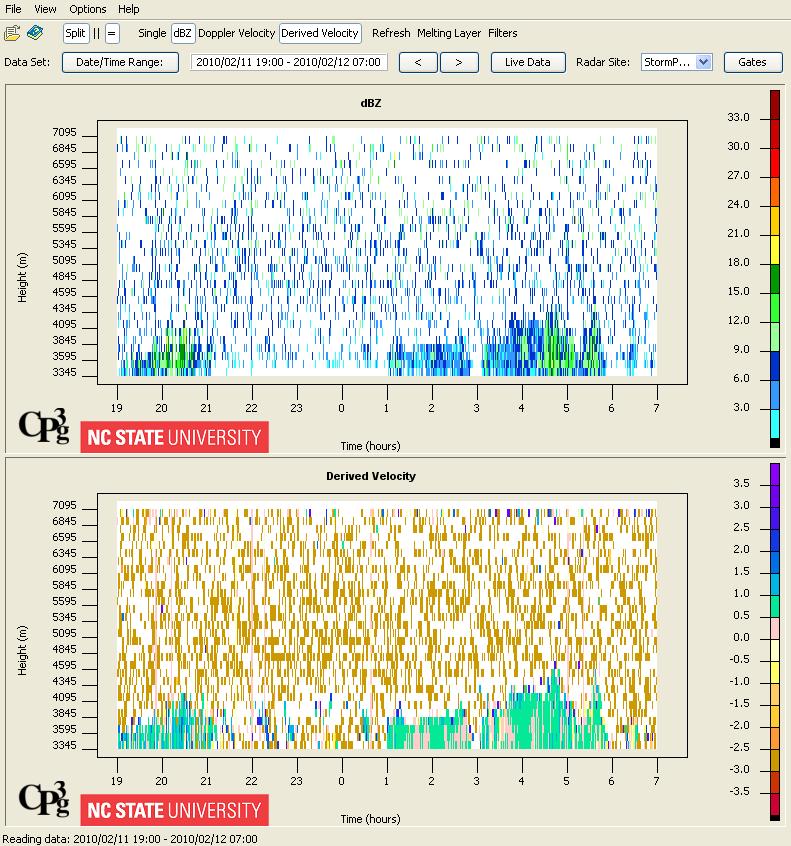
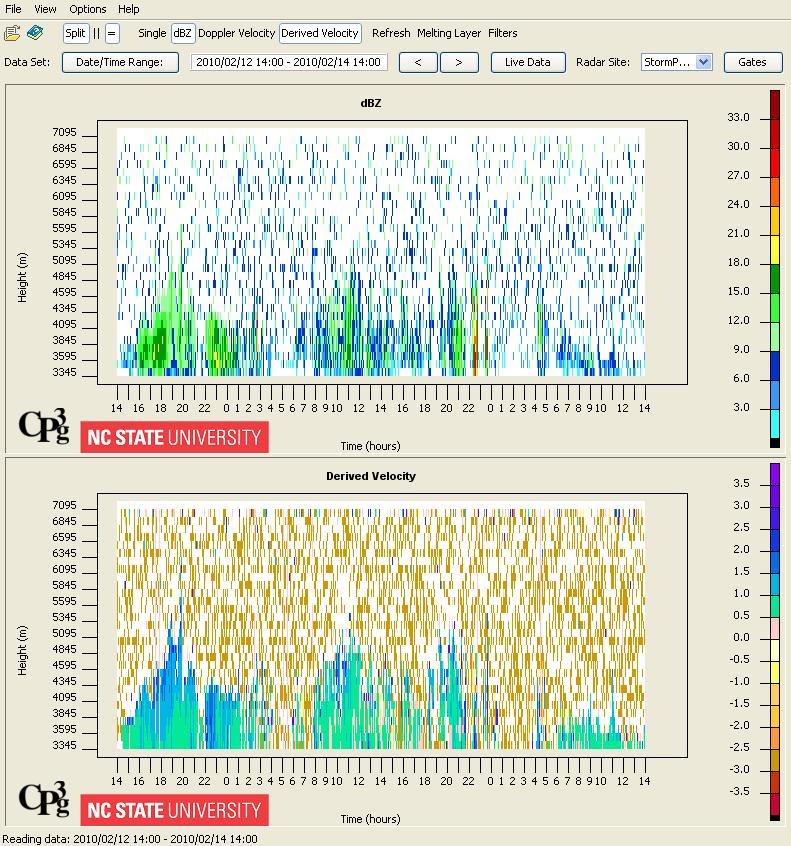
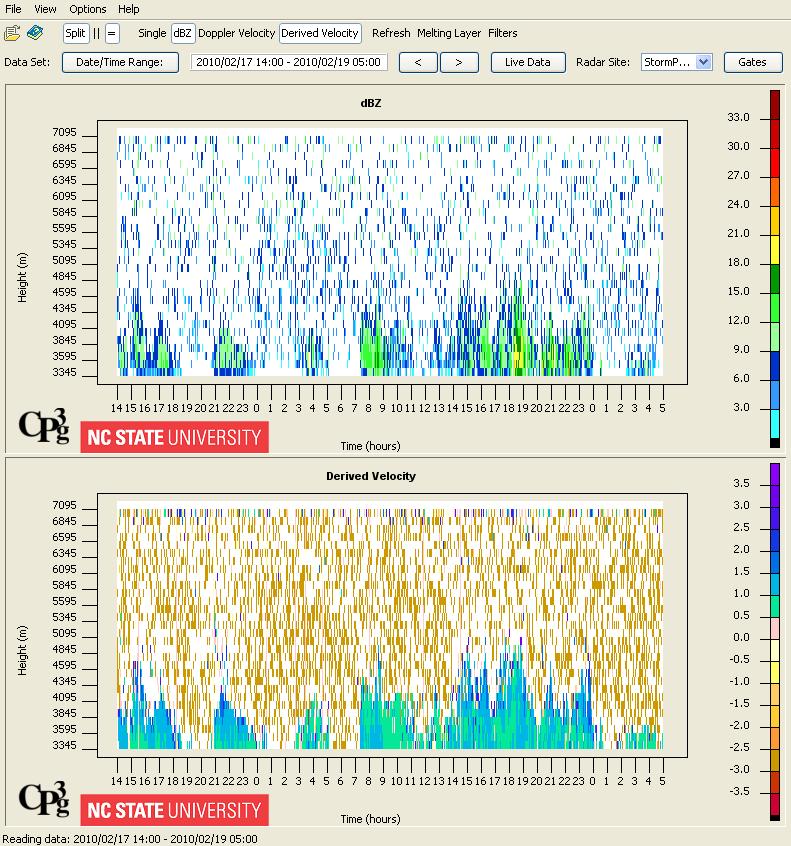
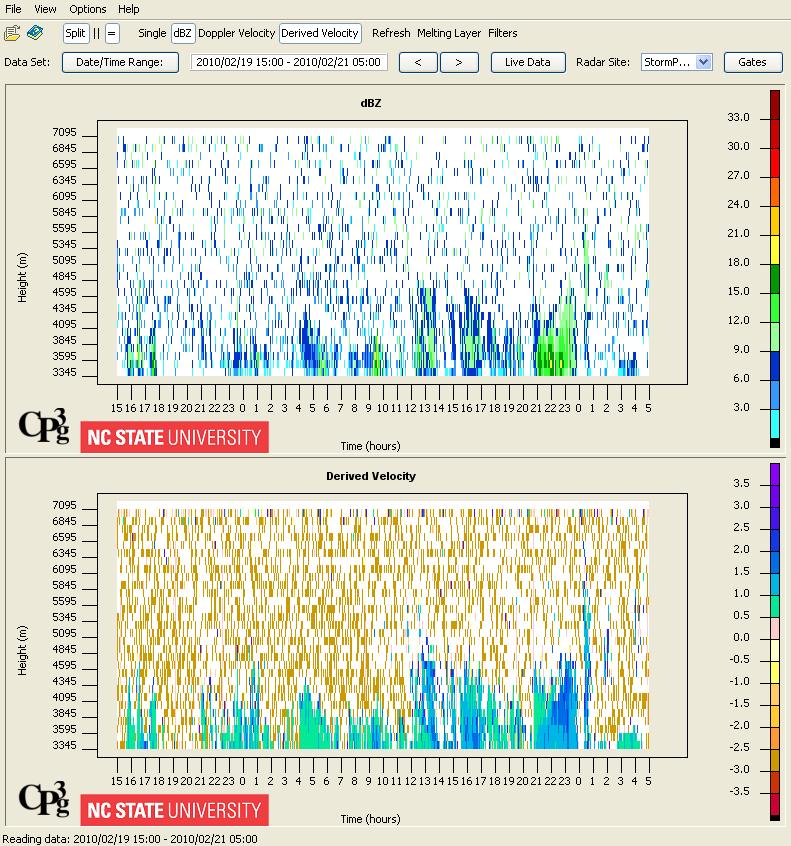
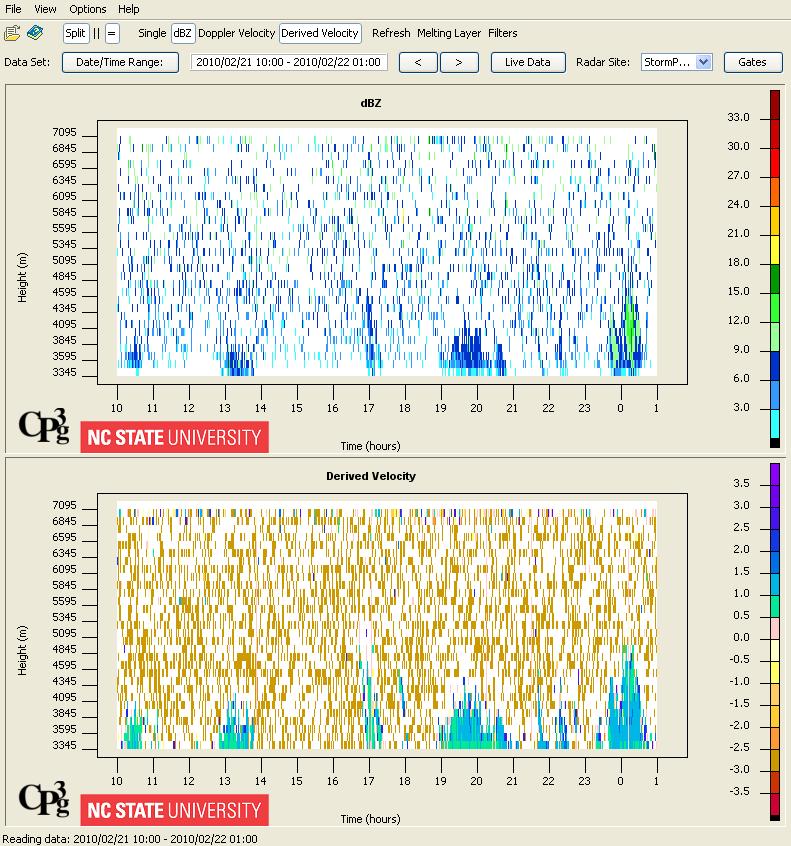
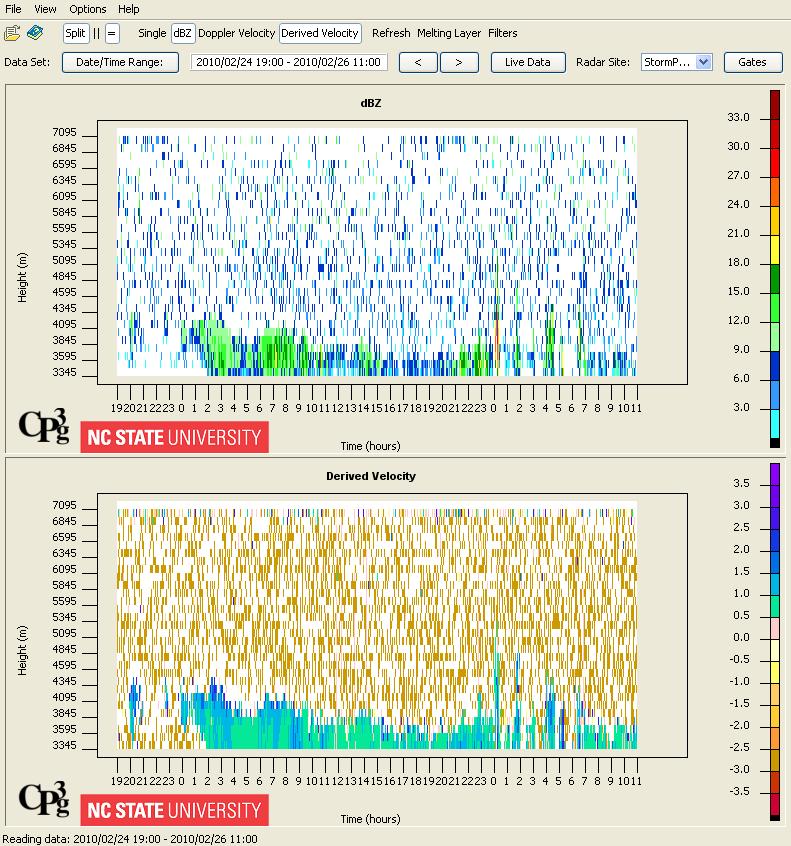
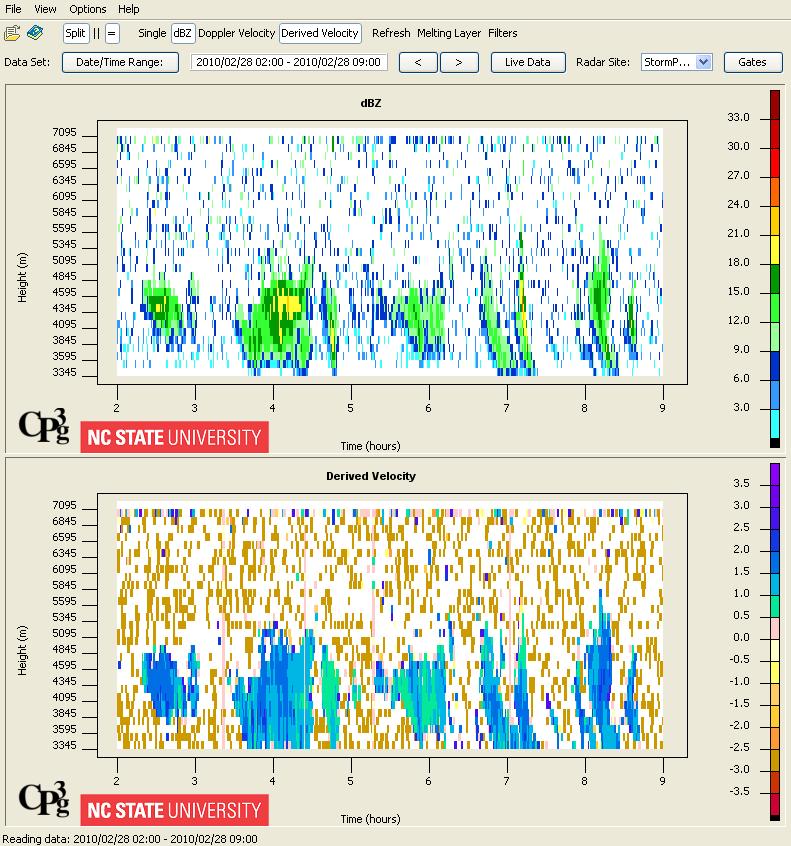
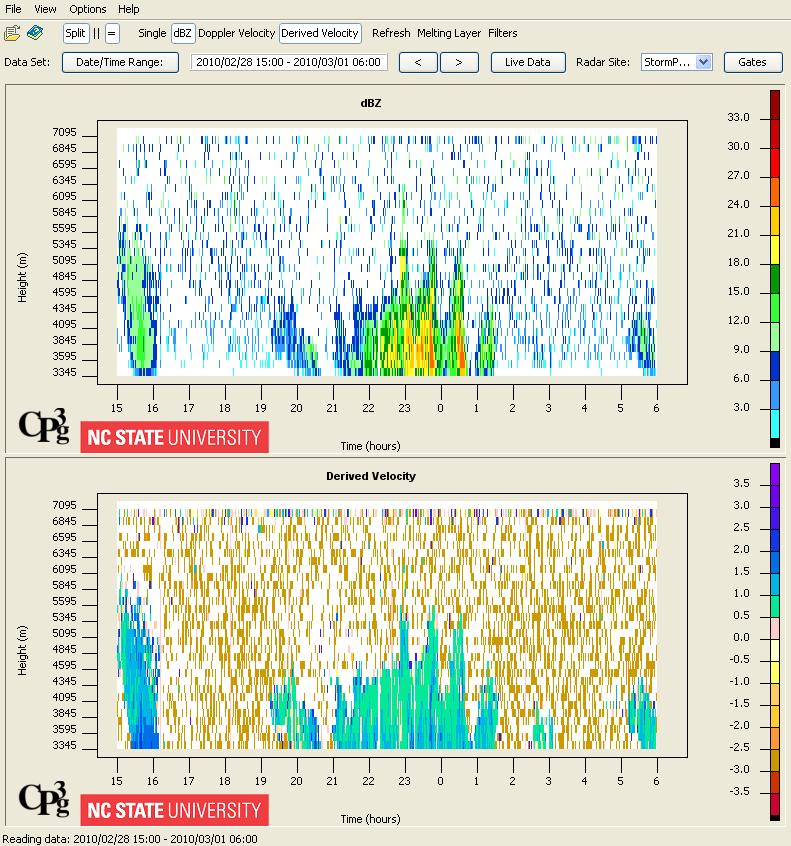
OPL MRR Viewer data example. Notice dBz (top) and derived velocities (bottom) of topographically forced snowfall at the SPL site. |