The Environment Analytics Research Group has deep expertise in the analysis of large data sets at the intersection of environmental conditions, ecology, and infrastructure.
We produce and curate high quality meteorology observation data sets for use in AI training, and applied and basic research. We have extensive experience distilling large data sets and combining information from multiple sources including multispectral satellite, radar, lidar, in situ meteorological measurements, and numerical weather model output. We have made and analyzed ground-based, shipborne, and airborne field observations in varied settings including open ocean, tropical islands, mountains, and the coastal US.
Applications include: weather and climate decision support, evaluation of numerical forecast and reanalysis model outputs, boundary layer/cloud/precipitation interactions and processes.
Environment Analytics YouTube Channel showcasing our work.
Current and recent projects within our research group at North Carolina State University:
Model Evaluation and Weather Decision Support
- US Navy Office of Naval Research–Cloud and boundary layer forecast evaluations [4/2024 – 12/2026]
- US Navy Office of Naval Research–Marine Boundary Layer Characteristics, Clouds, and Air-Sea Interactions Matching Observations and Model Forecasts to Diagnose COAMPS and NEPTUNE Weaknesses [1/2021 – 12/2024]
- Delta Air Lines–Meteorology Weather Prediction Model Verification [6/2019 – 6/2021]
Climate Adaptation Planning
- Collaboration with University of Nevada-Reno — Summit Lake Paiute Tribe Climate Adaptation Planning for Ecosystems and Community (5/2025-9/2025)
Winter Weather
- Collaboration with University of Nevada-Reno — Winter Storm Observations Processing and Analysis [6/2026 – 1/2027]
- NASA–IMPACTS (Investigation of Microphysics and Precipitation for Atlantic Coast-Threatening Snowstorms) [1/2019 – 12/2025]
- NSF–Collaborative Research: Extensive Field Observations and Modeling to Understand Multi-band Precipitation Processes within Winter Storms [8/2019 – 7/2023]
NASA’s IMPACTS website
NASA IMPACTS 2023 Field Catalog
NASA IMPACTS 2022 Field Catalog
NASA IMPACTS 2020 Field Catalog
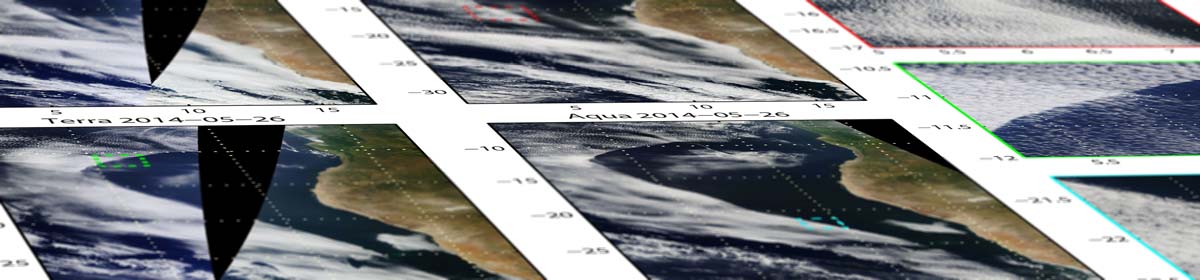
Marine Clouds and Precipitation
- NSF–Collaborative Research: Mechanisms Governing Synoptic-scale, Rapid Cloud Dissipation in Subtropical Marine Low Clouds [7/2017 – 6/2022]
Products and Resources
Clouds and Boundary Layer Observations
Eastern Carolina Atmospheric Observing Site (ECAOS)
Northeast US Regional NEXRAD radar mosaics of winter storms from 1996-2023
Tomkins et al. (2023) Dryad archive Part 1 [Dataset]
Tomkins et al. (2023) Dryad archive Part 2 [Dataset]
This dataset contains over 14,000 hours of regional radar mosaics over the northeast US from 600+ winter storm days between 1996-2023. Winter storm days are defined when at least 2 out of 15 surface stations in the northeast US produced at least 1 inch of snow over the 24 hour period. Sequences of these mosaics aid in analyzing the precipitation area and the structures within winter storms. Radar reflectivity data is combined from the first, lowest (0.5 degree) elevation angle from 12 NEXRAD WSR-88D radars in the northeast US. The scans occur every 5-10 minutes from each radar depending on the radar scan settings. This product is different from other widely used radar mosaics such as the MRMS produced by NOAA since it does not interpolate to a constant altitude and thus preserves the finer scale details in the reflectivity field. Because the data used to create these mosaics are not interpolated to a constant altitude, the altitude varies over the region (altitudes of radar scan used at each grid point are provided as a field for each data file). This data set is specifically designed to analyze fine-scale structures in winter storms.
Part 1 contains files for 1996-2012 before dual-polarization integration so files only contain reflectivity. Part 2 contains files for 2012-2023 after dual-polarization integration so files contain reflectivity, correlation coefficient, and muted reflectivity field.
Low pressure tracks for northeast US winter storms from 1996–2023
Tomkins et al. (2024) OSF Low Pressure Tracks Dataset and Software
This dataset contains low pressure center tracks from 600+ winter storm days in the northeast United States between 1996-2023. Winter storm days are defined when at least 2 out of 15 ASOS surface weather stations in the northeast US produced at least 1 inch of snow over the 24-hour period (see Tomkins et al. (2023) for more details). The structure and evolution of winter storms is largely governed by the large-scale low pressure system, so information about the location and strength of the system is very useful when analyzing these impactful cool-season precipitation systems. One can use the low pressure center track to put storm observations in a Lagrangian framework. Removing the large-scale movement of the low pressure system helps to isolate changes related to the evolution of winter storms and their component structures.
The low pressure tracks are created from the ERA5 hourly reanalysis mean sea level pressure (Hersbach et al. 2020) using the methods of Crawford et al. (2021). We subset the global 0.25 degree resolution ERA5 mean sea level pressure (MSLP) field to the region of Eastern North America (-90 to -60 degE, 25 to 55 degN). For a given winter storm day, we track over +/- 1 day to capture the full evolution of a given low pressure system.
MicroRainRadar Resources Page for links to software and storm perusal web pages from our vertically-pointing radar deployments.
Weather-Flow is an extension of the EarthNullSchool tool for greater utility in college-level education. This visualization aid provides a more intuitive depiction of atmospheric flow and interactions among winds, pressure, and temperature and their changes with altitude. Includes current data and archived data back to September 2018.
Pressure Sensor Networks Dashboard used for research on atmospheric gravity waves. There are currently regional networks in the New York Metro area, Eastern Long Island, Toronto Metro area, and Raleigh, NC using low cost high precision pressure sensors designed and built by Matthew Miller.
Disclaimer: The material located on this site is not endorsed, sponsored or provided by or on behalf of North Carolina State University.