Virga to Rain Storm Summary of 2005-2006 Winter
Season (November - March) - 17 Storms
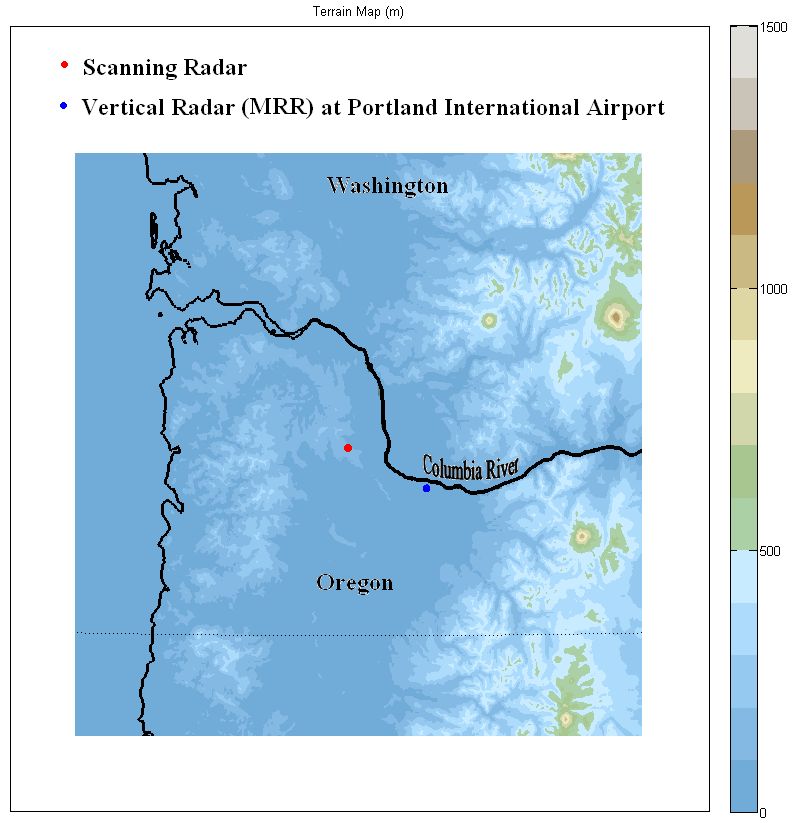
Portland International Airport Weather Station, Oregon (45°35'N , 122°36'W / Elevation: 5.8 m)
|
|
|
Trends |
Wind Direction |
Temperature |
RH |
Pressure |
Year |
Month |
Day |
AGL |
Continuity |
Start Time (UTC) |
Duration (hrs) |
Avg. Temp. (°C) |
Avg. |
At Storm Maturity |
Wind Speed (m/s) |
Precip. (in) |
before* |
during |
before* |
during |
before* |
during |
2005 |
11 |
|
Tall to Borderline |
Scattered |
19:00 |
46 |
5.1 |
S |
SE |
7.3 |
1.39 |
increasing |
up - down |
decreasing |
up - down |
decreasing |
down - up |
2005 |
11 |
|
Borderline to Tall |
Scattered |
19:00 |
29 |
4.9 |
S |
S |
15.6 |
0.34 |
increasing |
down - up |
decreasing |
increasing |
decreasing |
down - up |
2005 |
12 |
|
Tall to Shallow |
Scattered |
08:00 |
72 |
4.4 |
S |
S |
10.8 |
1.43 |
decreasing |
down - up |
increasing |
flat |
decreasing |
increasing |
2005 |
12 |
|
Tall |
Scattered |
16:30 |
9.5 |
8.6 |
SE |
SE |
10.7 |
0.05 |
decreasing |
increasing |
up - down |
down - up |
increasing |
decreasing |
2005 |
12 |
|
Tall to Shallow |
Scattered |
02:30 |
36.5 |
8.6 |
SE |
SE |
11.5 |
1.79 |
decreasing |
up - down |
flat |
down - up |
decreasing |
down - up |
2006 |
01 |
|
Borderline to Shallow |
Continuous |
16:30 |
11.5 |
6.6 |
SE |
SE |
13.1 |
0.36 |
increasing |
increasing |
decreasing |
increasing |
decreasing |
increasing |
2006 |
01 |
|
Tall |
Scattered |
06:30 |
41.5 |
7.0 |
SE |
SE |
12.3 |
1.66 |
decreasing |
up - down |
down - up |
down - up |
flat |
decreasing |
2006 |
01 |
|
Shallow to Borderline |
Scattered |
13:30 |
11 |
7.5 |
S |
S |
7.1 |
0.06 |
flat |
increasing |
increasing |
flat |
increasing |
increasing |
2006 |
01 |
|
Tall to Shallow |
Continuous |
18:00 |
12 |
7.0 |
S |
SE |
16.8 |
0.60 |
flat |
down - up |
decreasing |
increasing |
decreasing |
decreasing |
2006 |
02 |
|
Shallow |
Scattered |
00:00 |
40 |
4.3 |
SW |
NE |
2.4 |
0.08 |
increasing |
increasing |
down - up |
increasing |
decreasing |
down - up |
2006 |
02 |
|
Tall to Borderline |
Scattered |
17:30 |
87 |
6.8 |
S |
SW |
7.8 |
1.21 |
decreasing |
down - up |
decreasing |
increasing |
decreasing |
down - up |
2006 |
03 |
|
Tall to Borderline |
Scattered |
03:00 |
17 |
9.3 |
SE |
E |
18.2 |
none |
flat |
decreasing |
flat |
increasing |
decreasing |
increasing |
2006 |
03 |
|
Borderline to Shallow |
Scattered |
00:00 |
12 |
8.6 |
S |
S |
13.0 |
0.01 |
up - down |
decreasing |
down - up |
increasing |
down - up |
increasing |
2006 |
03 |
|
Borderline to Tall |
Scattered |
07:30 |
42 |
8.6 |
S |
SW |
10.6 |
0.23 |
decreasing |
up - down |
increasing |
increasing |
decreasing |
increasing |
2006 |
03 |
|
Borderline |
Scattered |
22:30 |
7 |
8.9 |
SE |
SE |
15.3 |
0.01 |
increasing |
decreasing |
decreasing |
increasing |
decreasing |
decreasing |
2006 |
03 |
|
Tall to Shallow |
Scattered |
18:00 |
36 |
11.4 |
S |
SE |
10.5 |
0.28 |
increasing |
decreasing |
decreasing |
increasing |
decreasing |
down - up |
2006 |
03 |
|
Borderline to Tall to Borderline |
Scattered |
18:00 |
8 |
8.3 |
W |
SW |
6.7 |
0.21 |
flat |
up - down |
up - down |
flat |
decreasing |
increasing |
2006 |
03 |
|
Tall to Shallow |
Scattered |
00:00 |
7 |
15.4 |
SE |
NW |
6.8 |
none |
increasing |
decreasing |
decreasing |
increasing |
decreasing |
down - up |
Version 1, 14 August 2012
web page credits: Micheal Tai Bryant, Sandra Yuter
This research is a collaboration by the
Department of Marine, Earth, and Atmospheric Sciences, North Carolina State University
This material is based upon work supported by the National Science
Foundation under Grant No. 0544766. Any opinions, findings and
conclusions or recomendations expressed in this material are those of
the author(s) and do not necessarily reflect the views of the National
Science Foundation (NSF).
contacts:
Dr. Sandra Yuter seyuter@ncsu.edu